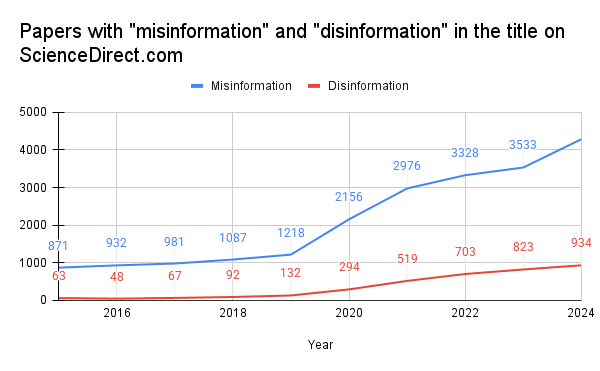
Right after the 2016 American presidential election, use of the the terms "misinformation" and "disinformation" on Twitter skyrocketed, presumably as people attempted to come to grips with what had just happened. A few years later (science takes time!), we see a marked increased in scientific papers trying to understand the phenomena.
This is a tricky subject to study because, on the one hand, it's hard to imagine another phenomenon for which there exists such a complete dataset, but, on the other, defining these terms relies on notoriously sticky concepts that can't be easily extracted from data (if at all), like truth, bias, reliability, etc. Even the distinction between misinformation and disinformation relies on intent, something hard to extract, especially at scale. My point here isn't to discuss this research field in its entirety (I take no stance), but to set up the tension between the vast, computer-legible corpus and the squishy ambiguity of the field's principle object of inquiry. For these papers to present quantitative results, something needs to fill the gap between the kinds of questions that data analysis can answer and the inherently uncomputable nature of truth, bias, etc.
A recent pre-print, titled "Measuring the co-evolution of online engagement with (mis)information and its visibility at scale," provides us with a nice example. Normally, when I feature a specific paper in a blog post, I do intend to pick on it, but, in this case, I don't think that these authors are doing anything particularly harmful, nor do I take any stance on the quality of their work or the veracity of their results. It's just a good starting point.
For our purposes, the specifics of the paper don't matter too much. To quickly summarize, they look at how reliable information propagated through Twitter during the pandemic, comparing it to misinformation, and found some differences. Their approach is quite sophisticated and, if you have the time, it might be worth skimming the abstract, looking at its well-made figures, and browsing its many mathematical contraptions to get a sense for the sophistication of its quantitative analysis, which all rests on the following dataset:
The dataset contains around 113.7 million retweets —interactions that allow users to rebroadcast the post (i.e., tweet) of another user to their followers on Twitter, collected second-by-second from 17 March 2020 to 12 February 2023, across countries with all content in English. These retweets are identified as being related to COVID-19, and each is classified into one of three types: factual (36.9%), misleading (7.7%) and uncertain (55.4%). [...] The raw data is collected by the COVID-19 Infodemic Observatory (https://covid19obs.fbk.eu) [...]
They describe the COVID-19 Infodemic Observatory as "a well-established [emphasis added] database of nearly 4,000 expert-curated domains assessed for scientific credibility." Put a pin in that bolded phrase for now while we consider the transformation that they describe here: They classify each individual tweet as factual, misleading, or uncertain based on its domain. If theluddite.org is misleading, then tweets containing links to theluddite.org are misleading. I again take no stance on whether this is a valid simplification, but I do think that it merits more discussion than it gets.
Digging further, we find that Infodemic Observatory's data also undergoes some transformations. From their FAQ (emphasis added):
A large number of these messages contain links to news or other sources (e.g., Youtube videos) which we identify as reliable or unreliable thanks to a large database of almost 4,000 web domains we prepared by integrating nine independent sources – both of scientific and journalistic origin – that label different web domains in terms of news reliability and fact-checking. These web domains cover a significant fraction of the overall web traffic in 127 countries around the world, the ones we consider in the COVID-19 Infodemic Observatory. We homogenized these sources, identifying a source as RELIABLE if it is i) scientific, ii) governamental [sic], or iii) a main-stream online news media with negligible political bias. A source is instead considered as potentially UNRELIABLE if it has a large political bias or it is known to spread satirical content, fake news or hoaxes, false narratives or conspiracy theories.
Recall that, in order to produce quantitative results, we need to resolve some ambiguities. At the top layer, we have "factual," "misleading," and "uncertain," which we now find is defined as "i) scientific, ii) governamental [sic], or iii) a main-stream online news media with negligible political bias." In other words, we transform the concepts of "scientific," "governmental," "mainstream news media," and "political bias" to get "factual" or "misleading." The first layer was only concerned with truth-adjacent notions, but now, in the supporting layer, we see more power-adjacent concepts: Truth comes from institutions with power (governments and mainstream news media), and sources that explicitly concern themselves with power in some way ("politically biased") are inherently dubious. If we look further in their FAQ, we get a nice example of just how tricky quantifying this really is (emphasis added):
We further distinguish classes of information sources into:
- Reliable.
- MainStream Media: recognized and politically unbiased mainstream media (bbc.co.uk, nytimes.com, ...)
- Science: Recognized scientific sources (who.int, cdc.gov, …)
- Unreliable.
- Satire: using humour and irony to expose and criticize news (cracked.com, ...)
- Clickbait: false advertisement designed to attract attention (mirror.co.uk, ...)
- Political: known politically biased media (vox.com, thesun.co.uk, ...)
- Fake: spreading fake news and hoaxes (breitbart.com, ...)
- Conspiracy: spreading false narratives and conspiracy theories (zerohedge.com, ...)
According to our authors, the nytimes.com is reliable and not politically biased, unlike vox.com. Describing cracked.com as satire is not quite right, but if you had to choose between those options, that's probably the least bad choice. Given the current American administration's shenanigans, I don't think that I need to explain why cdc.gov is problematic. And so on.
If we examine the site's "methodology" section, we find further transformations:
We collected manually checked web domains from multiple publicly available databases, including scientific and journalistic ones.
Specifically, we considered data shared by the sources listed in:
- Zimdar, M. My fake news list went viral but made up stories are only part of the problem.
The Washington Post [ Link ] (18 November 2016)- Silverman, C. Inside the partisan fight for your news feed.
BuzzFeed News [ Link ] (8 August 2017)- Fake News Watch
[ Link ] (2015)- Politifacts guide to fake news and what they peddle.
Politifacts.com. [ Link ] (20 April 2017)- The black list. La lista nera del web.
Bufale.net [ Link ] (2018)- Starbird, K. et al. Ecosystem or echo-system? Exploring content sharing across alternative media domains.
In 12th International AAAI Conference on Web and Social Media 365–374 (AAAI, 2018)- Fletcher, R. et al. Measuring the Reach of ‘Fake News’ and Online Disinformation in Europe
[ Link ] (Reuters Institute, 2018)- Grinberg, N. et al. Fake news on Twitter during the 2016 US presidential election.
Science 363, 374–378 (2019).- MediaBiasFactCheck
[ Link ] (2020)
Most of these sources are lists of domains. Some, like the one discussed in this referenced Washington Post article, provide a list of click-bait sites; others, like fakenewswatch.com, also deliver a list of click-bait sites, along with "satire" and the expected "fake/hoax news websites." In the end, these sources have mostly compatible taxonomies, but we must again note a data transformation. More importantly, note that each of these sources that provides a list of domains is, mercifully, the end of the line. After a human did the manual labor of compiling a list of sources and classifying them according to a schema, there's no more digging or transformations to look into.
MediaBiasFactCheck, however, provides quite a rich dataset that goes well beyond a few lists, so we have even more transformations to cover. Among other things, they quantify almost 10,000 sources along three axes: bias, factual reporting, and credibility (the distinction between the second and third remains unclear to me). To get a sense for how it works, let's look at their methodology page (emphasis added):
Bias is inherently subjective, and while no universally accepted scientific formula exists to measure it, our methodology uses objective indicators to approximate and represent bias. Each evaluated source is placed on a bias scale, visually represented by a yellow dot, to indicate its position. This is complemented by a “Detailed Report” that explains the source’s characteristics and the reasoning behind its bias rating. [...] Human reviewers conduct all evaluations and scoring to ensure accuracy and a comprehensive understanding of the content.
To understand these "objective indicators," we need only scroll down the page:
The placement of a source on the Left-Right Bias Scale is determined by a weighted composite score derived from four categories: Economic System (35%), Social Progressive Liberalism vs. Traditional Social Conservatism (35%), Straight News Reporting Balance (15%), and Editorial Bias (15%). Scores are on a scale of -10 to +10, and the weighted average determines the overall bias score.
I encourage you to check out the entire rubric, but I suspect that an excerpt of just the first category will be sufficient to make my point.
Economic System (35%)
Evaluates the economic ideology the source promotes, from communism to no-regulation capitalism.
- -10: Communism – Advocates no corporatism, extreme regulation, and full government ownership of industries.
- -7.5: Socialism – Supports minimal corporatism, high regulation, and significant government ownership.
- -5: Democratic Socialism – Endorses reduced corporatism with strongly regulated capitalism.
- -2.5: Regulated Market Economy – Promotes moderate corporatism with balanced regulations.
- 0: Centrism – Balances regulation and corporate influence without significant bias.
- +2.5: Moderately Regulated Capitalism – Leans slightly toward corporatism with moderate government intervention.
- +5: Classical Liberalism – Emphasizes moderate to high corporatism with lower regulations.
- +7.5: Libertarianism – Advocates low government intervention and high corporate influence.
- +10: Radical Laissez-Faire Capitalism – Advocates for minimal to no regulation, with the economy governed entirely by free-market principles and private enterprise.
These definitions of "socialism" and "communism" are the exact strawman that Richard Wolff mocks in what became a bit of a meme:
Socialism is when the government does stuff, and it's more socialism the more stuff it does, and, if it does a real lot of stuff, it's communism.
Similarly, this description of the far right is an ahistorical fiction. The neoliberal world order was made through "government intervention." To think otherwise is to fall for its own myth-making. The American government created those "free markets" with a suite of well-documented techniques, from so-called "structural adjustments" to outright overthrowing democratically elected governments throughout Latin America and replacing them with far-right clients aligned with American corporate interests, like in the infamous "banana republics."
So now we must ask the obvious question: Who made the rubric? Is it a panel of experts? A university lab? What is their accountability structure? From the site:
Media Bias Fact Check, LLC is a North Carolina-based Limited Liability Company solely owned and operated by Dave Van Zandt. He makes all final editorial and publishing decisions.
The ultimate source for all this data is, as it turns out, some guy named "Dave."
Note that if you google Dave, like I did, you might find this note helpful, from his "contact" page:
He is not affiliated with The New School or David E. Van Zandt, who shares a similar name. Dave is an unaffiliated voter and resides in North Carolina.
Dave also has "a collective of volunteers and paid contractors," but no employees. The "about" page gives us some more details:
Dave Van Zandt is a registered Non-Affiliated voter who values evidence-based reporting. Though not a journalist, Dave has maintained a lifelong interest in politics and media bias. He originally pursued a Communications degree in college before ultimately earning a degree in Physiology. Since then, he has worked in the healthcare industry (Occupational Rehabilitation) while continuing to study media, language, and bias independently.
[...] Over the past 20 years, he has studied media bias and linguistics and has applied the scientific method to create a structured, evidence-based methodology for assessing media bias and factual reporting. [...] From the beginning, the site was supported solely through third-party advertising, which allowed it to grow organically. [...] Over the past 10 years, Dave and his team have refined their methodology and improved their source reviews, building MBFC into a consistently high-traffic site and one of the most trusted authorities on media bias and credibility.
So Dave is just some guy, but I'm also just some guy (in the end, we're all just some guy), and I think that you should listen to me. To explain the difference, here's more from that "about" page (emphasis added):
We expect disagreement with our ratings; however, personal attacks against individuals rather than critiques of our work reflect a misunderstanding of our mission.
We welcome scrutiny of our methodology and decisions—but we reject false political labeling designed to discredit independent analysis.
While individual volunteers and contributors may hold personal political beliefs—as all people do—our methodology is standardized, consistent, and applied uniformly to all sources, regardless of ideology.
The difference is that I argue my case without claims to neutrality. Dave, to his credit, admits that we all have political beliefs, but he claims neutrality through a system of quantification. Unfortunately for him, the problem is recursive. His claim ultimately rests on his own assumptions on what neutrality should look like, which I find absurd and naive.
Recall that we went on this journey to find what fills the gap between our desire to quantify and the unquantifiable. As we've seen throughout, if we dig deep enough, we find someone doing the labor of making lists, rubrics, schemas, and classifying things. The original paper confidently and without discussion labelled millions of tweets based on what Dave (and some others) said about the website in the tweet, but the original authors have almost certainly never heard of Dave. For this system to function, Dave's opinions must take on a form totally independent of Dave, because the original authors would never have taken this dataset seriously had it been presented as "Dave's thoughts on media." This is the spectacle of computation.1
Recall also that, in the first data transformation, when they tried to define "truth," a notoriously difficult concept to define, the authors inadvertently appealed to power. Why, then, does anyone listen to Dave? Isn't he just some guy? If we return to Dave's rubric, we see that Dave being just some guy means that his opinions are a rearticulation of the mainstream. Imagine if Dave had instead made a rubric that referenced Debord or Marx, as I just did, or if he questioned the left/right spectrum as unproductive and facile, like I recently did. No one would use it. His rubric reads like a naive parroting of American ideology because the point of his service is to provide a computationally-legible account of cultural hegemony masquerading as neutrality.
For example, consider the American conception of the mainstream media: The average American has absorbed that publications like The New York Times are liberal (in other words, on the left, in the American conception of left/right) but that, despite that lean, they are mostly credible.2 If we analyze Dave's data, we find exactly that:
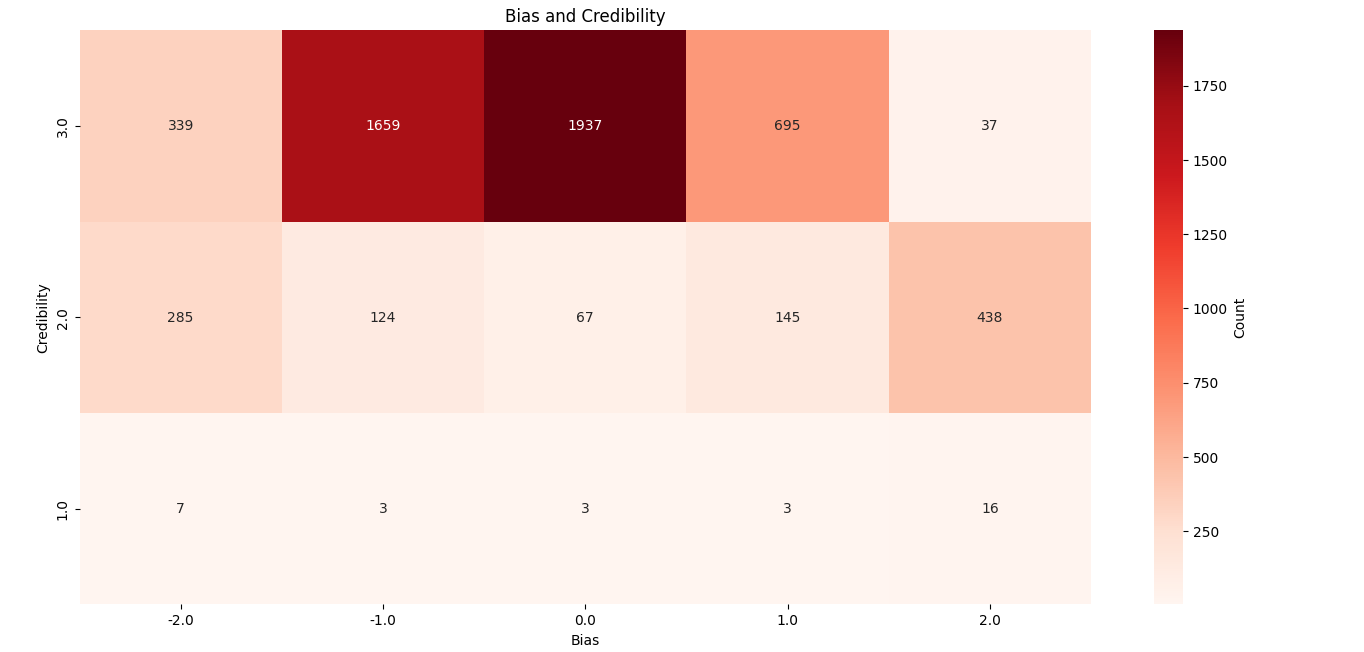
Credible organizations tend to be in the center, leaning slightly left. Here's their entry for The New York Times specifically:
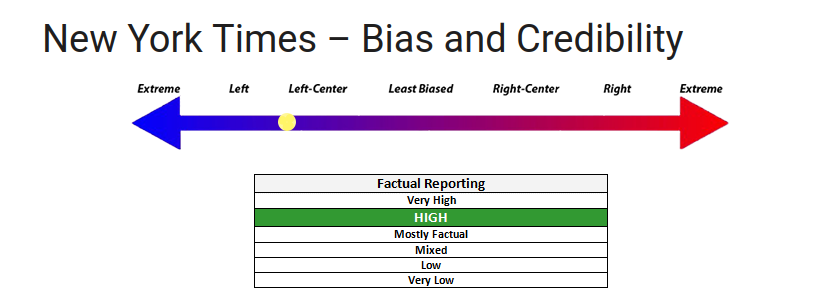
If we look at the analysis, we find that, when Dave explains his reasoning, he is more or less explicitly saying what I'm saying in my critique (but obviously uncritically). He is simply quantifying what most people would consider common sense.
The NYT looks at the issues from a progressive perspective and is regarded as “liberal.” According to a Pew Research Centers’ media polarization report, “the ideological Placement of Each Source’s Audience” places the audience for the New York Times as “consistently liberal.” Further, since 1960 The New York Times has only endorsed Democratic Presidential Candidates. Additionally, a Reuters institute survey found that 44% of respondents trust their news coverage and 33% do not, ranking them #6 in trust of the major USA news providers. In 2024, they endorse Democratic candidate Kamala Harris.
In review, the NYT utilizes emotionally loaded language in their headlines such as “Trump Again Falsely Blames Democrats for His Separation Tactic” and “A Financier’s profit-minded Mission to Open a Channel Between Kushner and North Korea,” [editor's note: Neither of those seemed particularly loaded to me, and those are presumably their best examples] however, they use credible sources such as law.cornell.edu, Financial Times, and The Washington Post. Story selection is typically balanced; however, wording tends to lean left in most cases. Editorials on the NYT almost always favor the left and sometimes are inaccurate; see failed fact checks below. The New York Times still qualifies for High Factual status due to the incredible amount of stories they publish, but the left-leaning bias has increased from the previous update.
I have no doubt that Dave does these analyses in good faith. The point here is that, were his beliefs different, no one would use his data. Similarly, if the original paper argued that tweets from sources Dave likes spread differently from those he doesn't, no one would care. This is, if not outright circular, then at least a dubious shape, but Dave does provide a necessary service for those who wish to work with quantitative data on the issue of media bias. In fact, for every dataset, there exists a Dave: The natural world does not come with a quantified representation of itself, but we are constantly awash in so much data that we forget that it must come from someone with their own interests, flaws, and ideologies, no matter what they claim, or how much computation they put it through. This is, in and of itself, neither good nor bad. It's just true, and it means that all quantitative results, no matter the number of statistical tests or the amount of computation, are necessarily derived from and embedded in a qualitative understanding of the world.
There's no simple process or heuristic to navigate this simple fact (like, to choose a totally random example, peer review). We have to think about each case. The rush to quantify, the pressure to publish, the overabundance of computation, and our social elevation of arguments expressed in statistics over those written in natural language simultaneously disincentivize this kind of reflection and incentivize people to quantify the world with whatever datasets are available, but that last condition is a false dichotomy: The gap between the unquantifiable world and the quantified world is always filled with some kind of theory. The spectacle of computation hides this relationship, and upon the spectacle rests the smug superiority of the technical fields, which rely on data and the language of statistics, over the squishy humanities. Studying misinformation, for example, probably ought to engage with decades of theorists in media, communications, politics, etc., but for us computer people to rely on them would jeopardize our coveted spot at the top of the pyramid of objectivity. If we want quantitative results to stand on their own, as some sort of Truth, independent of ideology, we abandon the part of the work that makes it mean anything. It's in these cracks that, in our story, we saw power leaking through.
As tech companies quantify more of our lives, there will always be a dataset available to study any phenomenon, but that dataset will always come from a tech company. Uncritical researchers risk being lured by these data-dispensing machines, allowing tech companies to place scientists in sandboxes of their creation. This post actually began over a year ago as a post about gamification. As I was looking into research on gamified language-learning (i.e Duolingo), I became increasingly frustrated by the very thing that frustrated these researchers, and I quote here from their wonderful articulation of the problem (citations removed for formatting reasons; emphasis added):
We expected that literature related to Duolingo would measure the learning outcomes and contextual understandings of language that learners achieve from using a gamified platform; however, the focus was on the creation of tools rather than the understanding of human agency associated with the use of these tools. Habermas noted that tools are but one aspect of technology. The way in which we direct our agency to gain knowledge using technology needs further inquiry to understand the implications that such mediating tools have for our learning. It is important to start asking ‘how’ and ‘why’ questions as opposed to (or at least in conjunction with) conducting ‘Does Duolingo…?’ types of inquiries. [...]
Finally, none of the reviewed studies attempted to challenge or reimagine the standard use of Duolingo – that is, as a largely behaviorist learning tool focused on rote learning, translation, competition and extrinsic rewards – which stands in contrast to a widely accepted view on language learning as process rooted in social and cultural exchange.
As I said about that first paper, and in full agreement with these authors, I have no problem with any single researcher asking these kinds of questions. Taken in aggregate, however, this allows a tech company to define our terms and set the premise. It cannot be the role of science to both accept data on its own terms and limit itself to never speak outside what the data says, because tech moguls, the people quantifying the world, have no such scruples. Here's Luis Von Ahn, the CEO of Duolingo, in his own words:
There are more people learning languages on Duolingo in the United States than there are people learning languages across all U.S. high schools combined, and this is true in most countries in the world. My hope is that as humanity, we can do what Duolingo has done for learning languages, but for all other subjects, where we can get people to learn math with mobile phones, like millions of people to learn math with mobile phones, or physics, or whatever.
This theoretically-impoverished tech-bro rambling is what links those quantitative results to any real meaning. It's the theory that organizes, creates, and makes data on language learning accessible because, like truth, knowing a language is itself unquantifiable. Attempts to quantify it, whether it be tests in schools or Duolingo, necessarily rely on human judgements about what matters in much the same way as the Infodemic Observatory dataset relied on humans using their judgement to compile lists. Most language-speakers for most of history, for example, could not read or write, but obviously spoke with native fluency, though that fluency would've been illegible to the methods we use to measure language fluency in school today. The people designing those tests have a certain idea of what learning a language means, as does Von Ahn, and using Duolingo's data easily morphs into accepting his interpretation of what learning a language ought to mean, though the spectacle of computation presents Duolingo's data as independent from its underlying ideology. Ultimately, studies using the data but unwilling to make normative claims, engage with the humanities, theorize, or, at the very least, critically contextualize the sources and meaning of its data, risk becoming apologia for power.
I give this example to explain the breadth of the problem, since measuring language acquisition and media bias are pretty different, but I want to end by exploring the depth of the problem. At the beginning, I said that I didn't intend to pick on that paper, and that's because Dave is the direct source for hundreds of studies. It's difficult to know how often he's the eventual source at the end of the line, as he was in our first example. Given what we now know, let's look at how other studies discuss their data sources, i.e. Dave. I'm choosing these more or less at random from the 515 search results for "site:arxiv.org 'mediabiasfactcheck.com'." From a paper titled "References to unbiased sources increase the helpfulness of community fact-checks:"
The bias ratings from Media Bias/Fact Check are a common choice in previous literature and are based on criteria such as the factuality of reporting, one-sidedness, and strength of political affiliations.
From "MurkySky: Analyzing News Reliability on Bluesky:"
We prioritized Media Bias Fact Check as our primary source due to its higher credibility and detailed analysis of news sources.
From "VeraCT Scan: Retrieval-Augmented Fake News Detection with Justifiable Reasoning:"
Mediabiasfactcheck.com is one of the most comprehensive resources for assessing media bias on the internet, offering credibility ratings for over 8,000 news publishers
And so on. Note that, for every paper that had a sentence or two explaining their source, I found at least 3 that simply cited it without explanation. I went through a few pages of search results and didn't find a single paper giving a reason for their choice other than what essentially boils down to "everyone else uses it" and/or "they have a lot of data."
Knowing what we now know, how are we to reinterpret these findings? Zooming way out, in the mainstream, the same people worried about misinformation also "trust the science." Many have adopted this phrase (or some variant of it) as one of their main political slogans. They see misinformation as the opposite of science, or even as a disease for which science is the cure. This is an enormous degree of trust. Studies that unquestioningly rely on Dave's data, many of which study the very phenomenon for which science is the supposed anecdote, probably don't live up to their expectations.
It does mean something that sources Dave likes are more common on Bluesky (to pick on the second example above), but it definitely doesn't mean what the authors think it means. Instead, they took Dave at face value, and here we see another feature of the spectacle of computation: Computers can be amazing tools for thinking, but they can also be tools to justify not thinking.3 They can't, for example, be dazzled by rhetorical flair or left speechless by a pretty smile, nor do they care about status or credentials. Writing code forces us to be precise, and the result then gets interpreted as literally as is logically possible by a computer, producing reusable artifacts (code and data). This is immensely valuable, but, as we've seen, this output only matters if someone actually did the thinking. It's the theory behind the code that gives it meaning, not its output. If instead we just put some bullshit into code and generate some output, it means nothing, but the output has the same sheen, a kind of stolen valor.
By focusing on how to quantify without stopping to think about what it means, Dave used the computer as a tool to avoid thinking. This was hard to know from his data, but became clear as soon as we read his methodology, which, to his credit, he took the time to write. In the end, he produced a reusable, shiny, quantified artifact, complete with an API and an official-looking UI, upon which rests the conclusions of hundreds if not thousands of studies, representing unknowable amounts of computation and thousands of hours of human labor, all from people who themselves also didn't do the thinking, trusting that someone else had, fooled by the output of Dave's computation, and presumably without having read Dave's words or even knowing who he is. These results too become a shiny, quantified artifact upon which we continue to build a postmodern tower of uninterpretable if not outright meaningless results, one of many such monuments to the spectacle of computation in scientific literature.
I want to reiterate the influence of Weizenbaum's Computer Power and Human Reason (footnote 3). The last few paragraphs are directly inspired by the book, but he also influenced my thinking on the entire post and well beyond. Similarly, I must once again acknowledge the influence of Bowker and Star's Sorting Things Out: Classification and Its Consequences. It's impossible for me to think about where data comes from or what it means without referencing my copy.
1. Debord's The Society of the Spectacle begins: "In societies where modern conditions of production prevail, all of life presents itself as an immense accumulation of spectacles," which itself borrows from Marx's Capital. Marx argues that commodity production hides the social nature of production, and we instead view society through the relationships between objects and exchange, rather than as people making things. It's a kind of "fetishism" ("magic") that changes the nature of the objects produced. Debord extended that idea to the Spectacle. The point is that, through the magic of computation, the data presents itself on its own terms, as an independent object, as if produced by magic, not as the product of Dave et al's labor. So maybe, to borrow a phrase, in societies where modern conditions of production prevail, all of science presents itself as an immense accumulation of data.
2. As Noam Chomsky notes in Manufacturing Consent and Necessary Illusions, this itself serves an important function in the propaganda machine. If we call The New York Times et al "liberal," it stakes out their editorial stance as the farthest-left border of acceptable discourse.
3. This point is from Weizenbaum's Computer Power and Human Reason, an amazing and important book.